Circular Histogram with Bokeh
Today I focused on adding a circular histogram for ArviZ with Bokeh as backend. I have worked with Bokeh in the past when developping ArviZ’ pairplot function. Back then the use of Bokeh helped improve code readability quite a bit compared to Matplotlib.
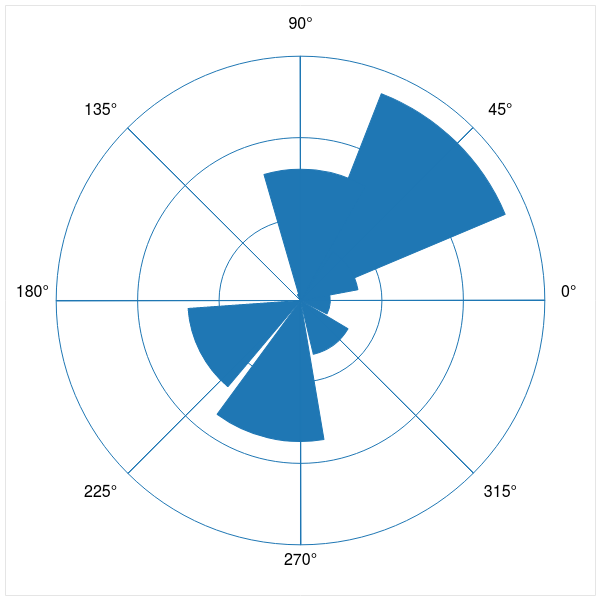
The first thing I learned when I started working on a circular histogram using Bokeh as backend, is that it does not support polar projection, as explained in this issue. This implied coding a few things that were available in Matplotlib. For example: placing ticks and tick labels in the right positions was a bit tricky. This is the result so far:
Next week I would like to improve on this function’s flexibility and tidy up the code. You can take a look at it in this PR.
Have a great weekend! :)