First weeks of coding phase
In this blog post I will share my progress so far in GSoC 2020 with ArviZ. My intention for this blog post is to reflect the work in progress for discussion and planning purposes. Beware that there is little to no finished work displayed.
Uploading a new InferenceData object
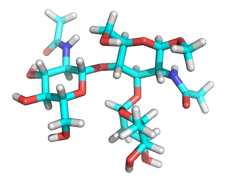
Given that my project involves working with circular variables, the first task I encountered was to find a suitable InferenceData object, to use in examples and tests. As I have worked with molecules φ and ψ torsion angles in the past, I have some models and data that came handy.
The InferenceData object I decided to upload to figshare.com contains the sampled values for two pairs of φ and ψ torsion angles in a glycan molecule. This glycan molecule is a part of a resolved protein structure under PDB (Protein Data Bank) id.: 2LIQ. It is a quite small glycan, only containing three subunits.
After uploading it to figshare.com, I made it available to import form ArviZ with:
torsionals = az.load_arviz_data('glycan_torsion_angles')
Here’s a code snippet that cointains a brief description of the model used to obtain this InferenceData object.
    "glycan_torsion_angles": RemoteFileMetadata(
        filename="glycan_torsion_angles.nc",
        url="http://ndownloader.figshare.com/files/22882652",
        checksum="4622621fe7a1d3075c18c4c34af8cc57c59eabbb3501b20c6e2d9c6c4737034c",
        description="""
Torsion angles phi and psi are critical for determining the three dimensional
structure of bio-molecules. Combinations of phi and psi torsion angles that
produce clashes between atoms in the bio-molecule result in high energy, unlikely structures.

This model uses a Von Mises distribution to propose torsion angles for the
structure of a glycan molecule (pdb id: 2LIQ), and a Potential to estimate
the proposed structure's energy. Said Potential is bound by Boltzman's law.
""",
    ),
}
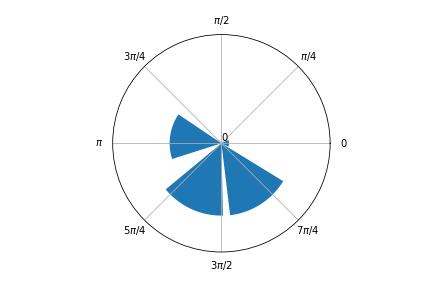
Circular Histogram plot
I managed to obtain a circular histogram modifying the ArviZ plot_dist function. I added a new argument to plot_dist called is_circular, in order to obtain the following plots.
We were having some discussions with ArviZ developers about incorporating the variables domain into the InferenceData object so that ArviZ can automatically detect if the variable is circular and proceed accordingly. This would be very convenient for plotting circular variables.
Here’s an example of a circular histogram:
az.plot_dist(torsionals.posterior.tors, is_circular=True, kind='hist')
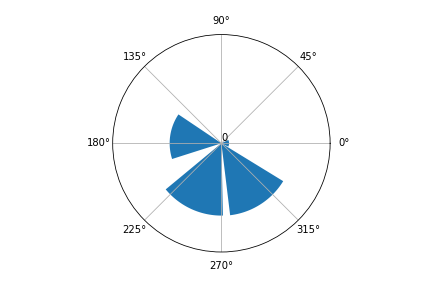
While I was at it, I realized that when the input was in degrees the plot was not correct. This issue was a result of an innappropiate interpretation of the computed bins by the plotting function. I decided to internally check if the input is in degrees and transform it to radians.
if values.min() < np.pi and values.max() > np.pi:
	values = np.deg2rad(values)
This is just a practical rule I came up with. I would like to check if there is a more theoretically supported way to do it.
With this little rule and providing an input in degrees, I got this plot:
Circular KDE plot
After working a bit on a circular histogram, getting a circular KDE plot was quite straightforward.
az.plot_dist(torsionals, is_circular=True)
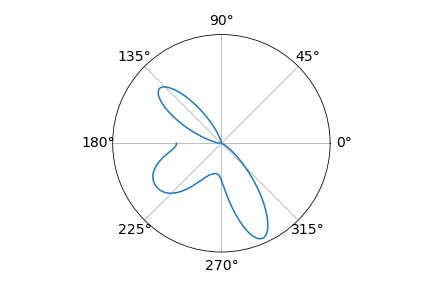
As you can see, there’s an issue with this KDE as the density’s edges don’t meet. This is one of the main points to solve.
Circular Trace plot
For the circular trace plot I added an argument to the function called circular_vars. This is to identify which variables need a circular KDE.
az.plot_trace(torsionals, var_names=['tors', 'E', 'beta', 'alpha'], circular_vars=['tors'])
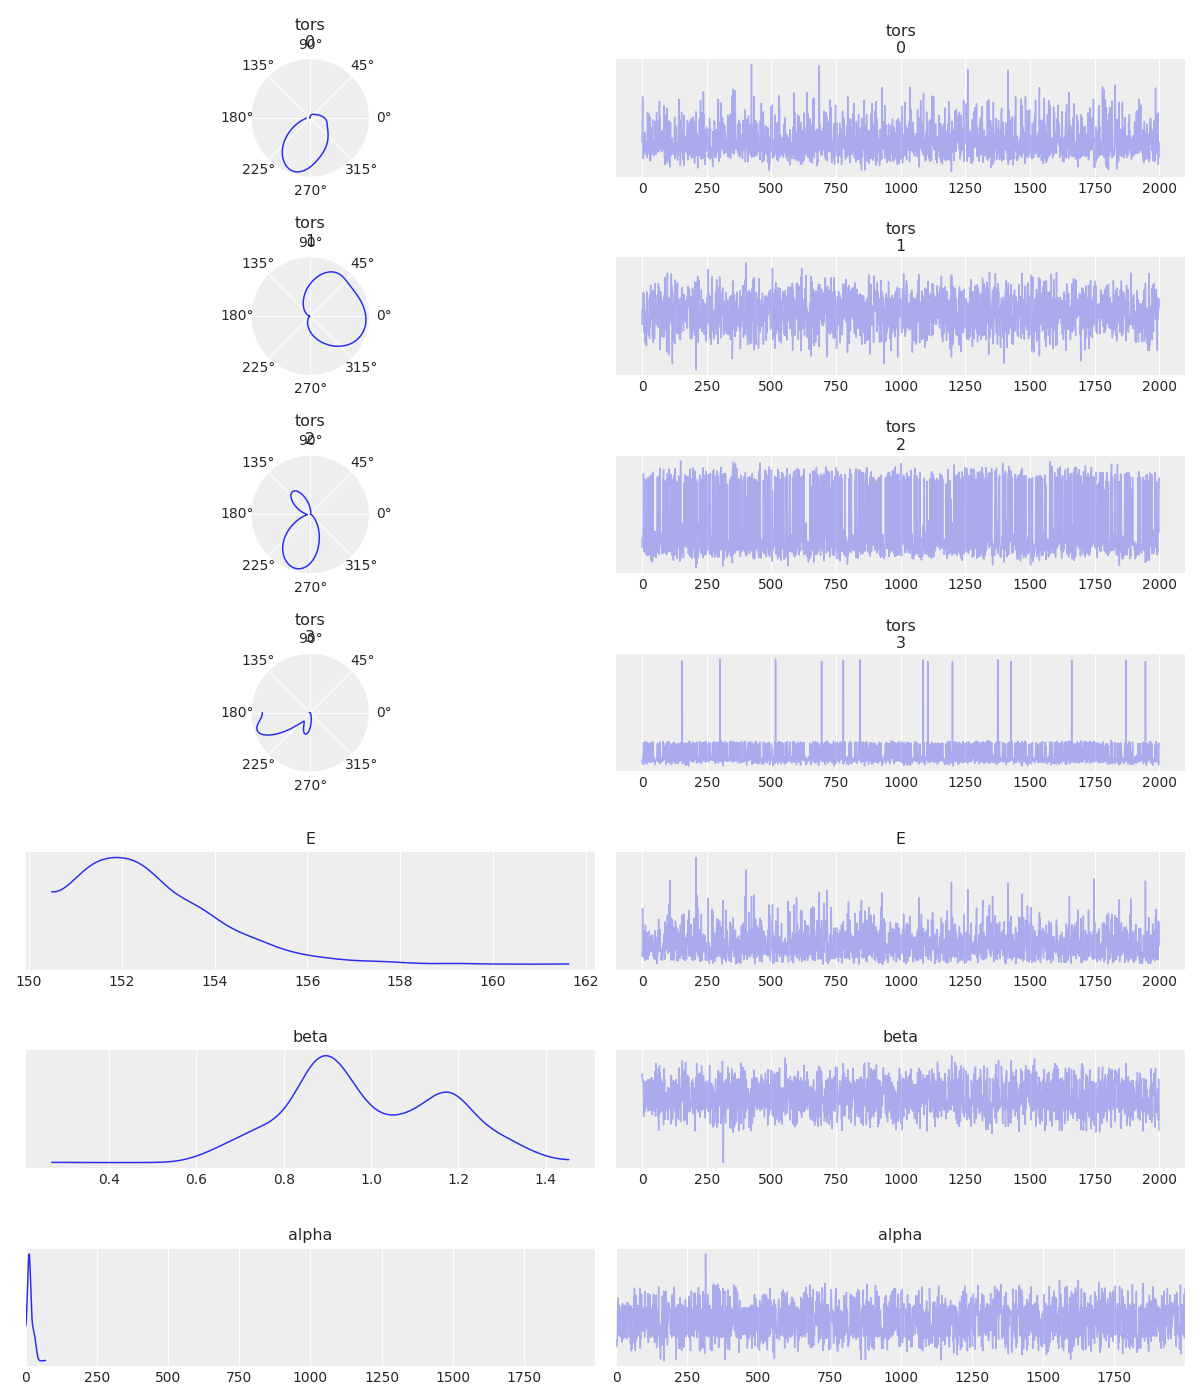
I am not so happy about how it looks, but it is a start…
Besides the problem I already pointed with the KDE plot, I think the circular plots are too small and in consequence the entire plot has to much white space. In general there is a lot to improve about this circular trace plot.
To-Do:
- Try to improve on ways to check if the input is in degrees or radians.
- Develop appropiate testing for the new arguments.
- Fix
plot_kdefor circular variables. This involves analysing ArviZ KDE computation and understanding why its functionning is not ideal in a circular setting. - Write documentation for the new arguments.
- Improve general aspect of trace plot.
You can take a look at the code at my branch. You can always contact me for suggestions and comments. Have a great weekend!